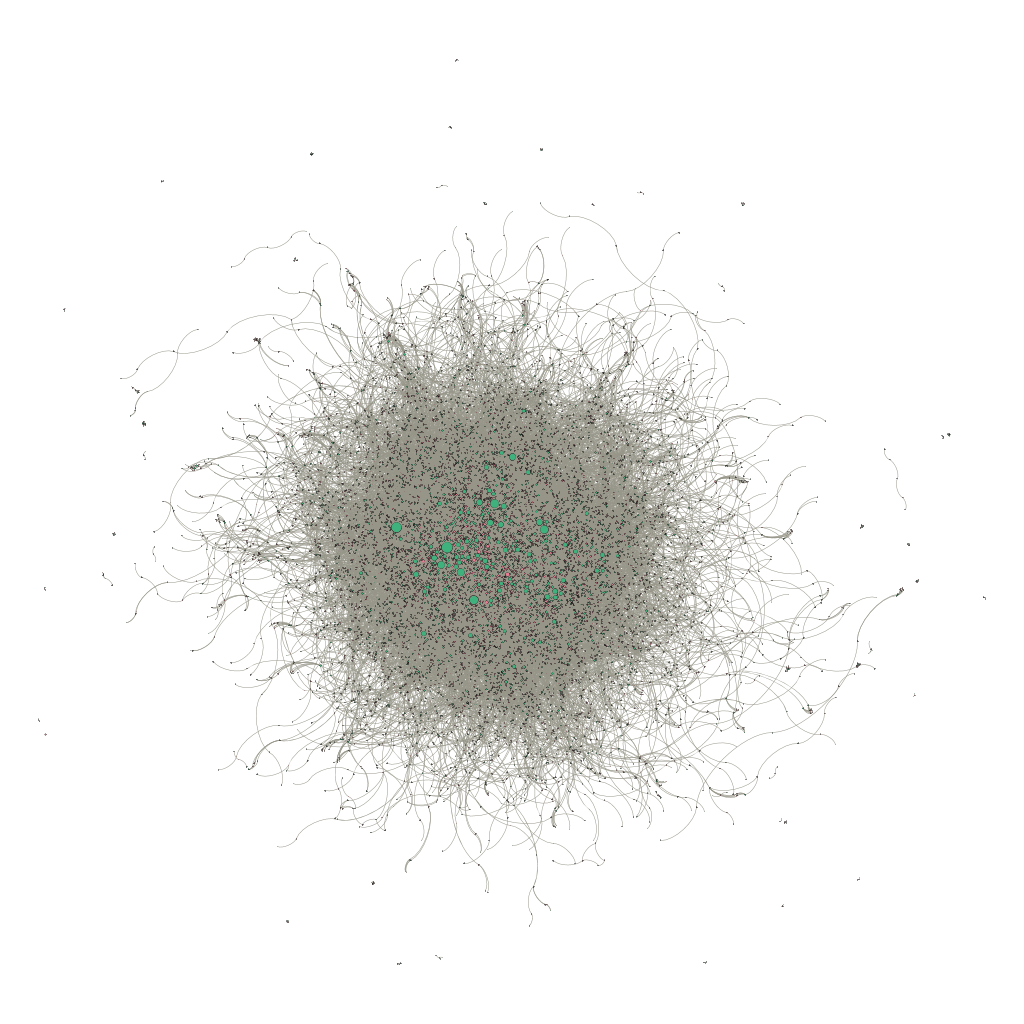
Network Analysis - Denmark's Elite
I’ve been messing around recently with network visualisations using Gephi and I wanted to look at an interesting dataset. To that end I pulled down some of the data from Magtelite.dk which is based on a PhD done by Christopher Ellersgaard and Anton Grau Larsen.
I have mangled the data and exported it into a javascript visualisation which you can see here. Note it doesn’t work very well on tablet, probably because the javascript performance is significantly slower.
Room for improvement
I’m very impressed with the quality of the online visualisation, but I think there is room for improvement in the graph itself. One issue is that there is no real sense of communities within the network, although it seems likely that there are communities of sorts within the data, for example, trade union representatives and their organisations or property developers and theirs. It’s possible to implement community detection in Gephi and I might try to do this in another iteration.
Another issue is that I have scaled the nodes by their degree such that the graph is dominated by a few organisations with very many members. It gives a sense of their scale, but it might be misleading, in that some board with 30 members could easily be less important than another with only 5 members. Another approach could be to scale organisation nodes by their revenue, however, this is probably not possible since organisations here does not only include companies: a large trade union will probably not have a very large revenue compared to many companies, but will still be powerful through its control over labour supply in its sector. Thus, it might be necessary to create some sort of generic power metric, combining revenues, employees and members, which can be applied to unions, institutes and companies alike.
Finally, the edges are neither labelled or weighted, so we only see a generic association between individuals and organisations. It would be helpful to see a label on the node connections and more useful still if they were weighted such that an individual’s directorship of one company would rank higher than board membership of another. This would also help Gephi to more accurately represent the network and the communities within it, but would require a bit of work to normalise and rank the many different forms of associations (I count 69 different association types in my export, including a number of duplicates and a large number of NAs).
Technical details
I found the data on Larsen’s GitHub page as R datafiles. I exported it to CSV format, wrote a quick Ruby script to convert it into nodes and edges before importing into Gephi. It wasn’t entirely obvious to me what the best data to use was, so I ended up combining the person and affiliation data from the pe13 and den files. I excluded all nodes with less than two connections to make the dataset more manageable. Once imported into Gephi, I used Fruchterman Rheingold and ForceAtlas 2 to group and space the data, before adding colouring and scaling based on node category and node degree respectively. I then exported the data to a HTML / Javascript document using the SigmaJS plugin. Note that this workflow comes from Martin Grandjean’s Gephi Tutorial.
I think the data here is from 2013, as that was the data available on the GitHub. They have apparently updated the data since then, but I couldn’t find the new data.
Here is the content of my Ruby conversion script, note that I have excluded the Events category from the analysis, as I think it added too much noise.
require 'csv'
require 'set'

nodes = CSV.open('trimmed_nodes.csv', 'wb')
edges_f = CSV.open('trimmed_edges.csv', 'wb')

nodes << [ 'ID', 'Label', 'Category' ]
edges_f << ['Source', 'Target', 'Type', 'Label']

persons = Set.new
orgs = Set.new
person_counts = {}
edges = []

CSV.foreach('pe13.csv') do |row|
  person = row[1]
  label = row[2]
  org = row[4]
  sec_org = row[6]
  persons << person
  person_counts[person] = (person_counts[person] || 0) + 1
  edges << [person, org, 'Undirected', label] unless org == 'NA'
end

CSV.foreach('den.csv') do |row|
  person = row[1]
  label = person
  org = row[2]
  role = row[3]
  source = row[6]
  next if source == 'Events'
  persons << person
  person_counts[person] = (person_counts[person] || 0) + 1
  edges << [person, org, 'Undirected', role]
end
persons.each do |p|
  nodes << [ p, p, 'Person' ] if person_counts[p] > 1
end
edges.each do |e|
  if person_counts[e[0]] > 1
    edges_f << e
    orgs << e[1]
  end
end

orgs.each {|o| nodes << [o, o, 'Organisation'] }
nodes.close
edges_f.close
